Scans Page Walkthrough
The Scans page is the operational hub for running new security audits and reviewing past results.
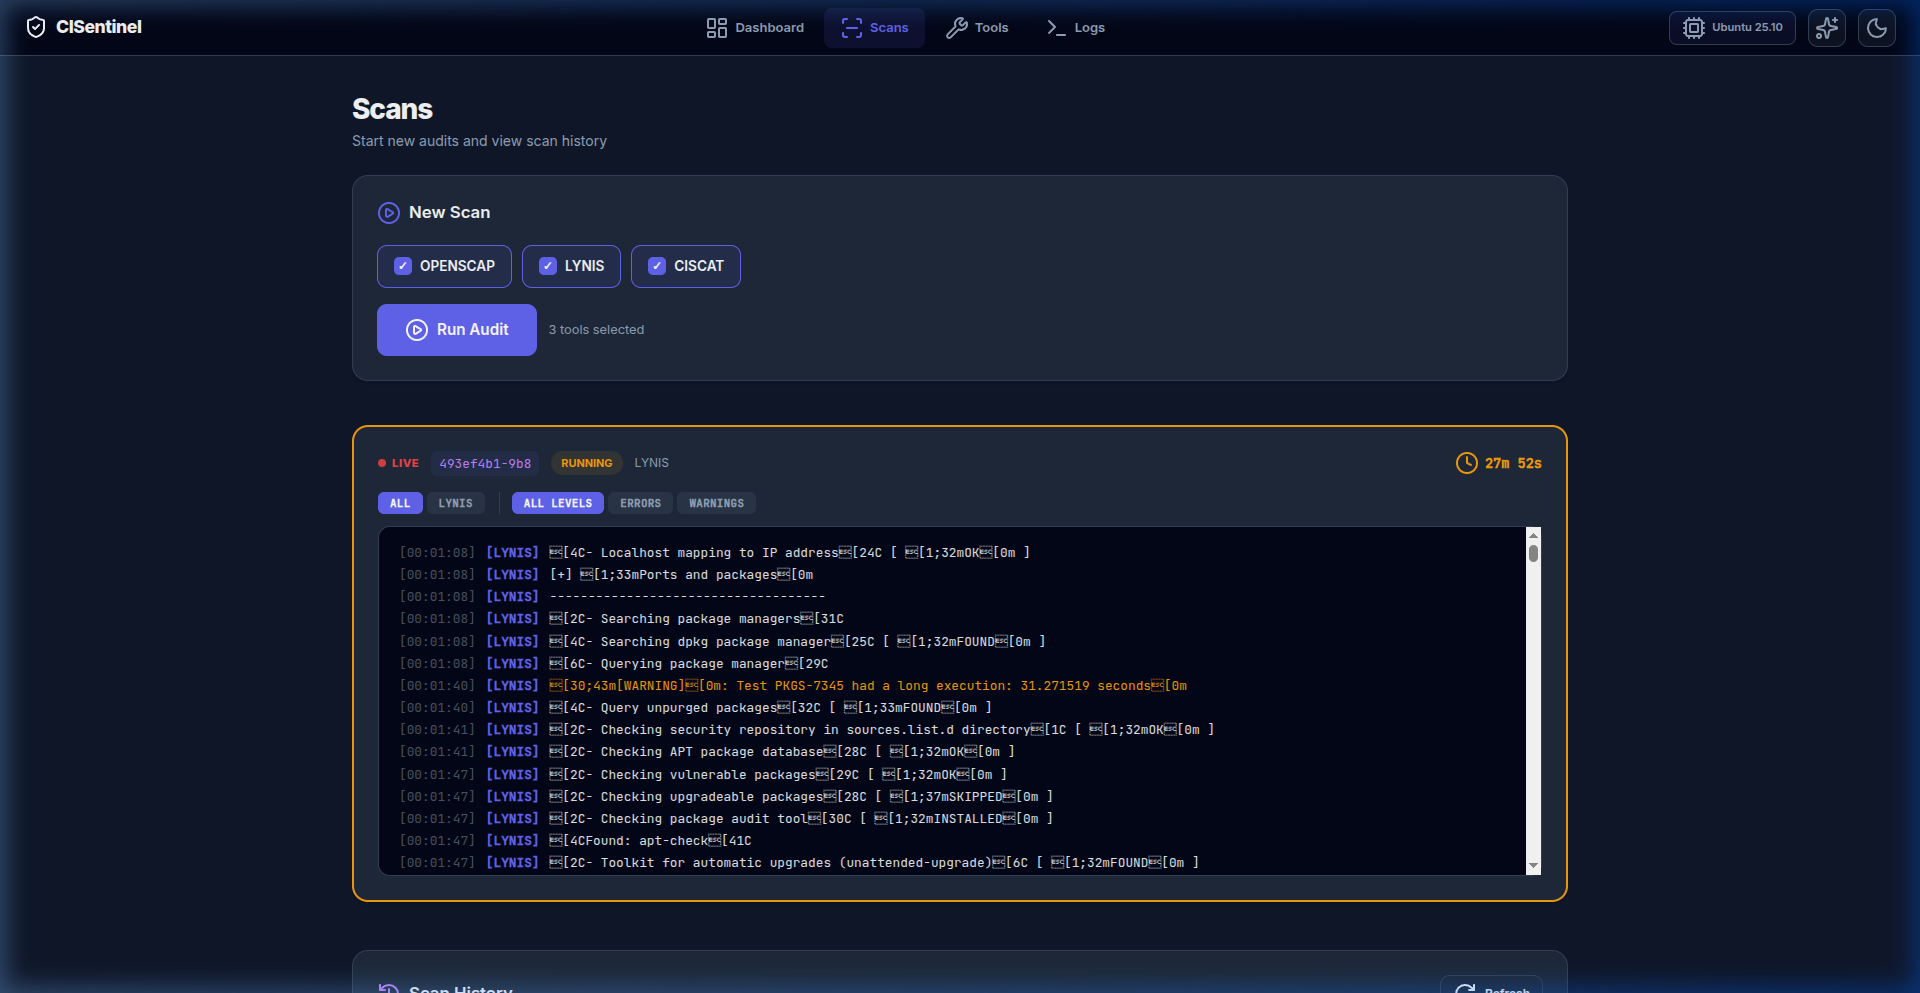
New Scan Panel
Tool Selector
A grid of tool cards, each showing: - Tool name - Installation status (Installed / Missing / Incompatible) - Checkbox for selection - Incompatible tools are grayed out with reason
Running an Audit
- Select desired tools via checkboxes
- Click "Run Audit" button
- The tool count indicator shows "X tools selected"
Live Scan Card
When a scan is running, a live scan card appears showing:
- LIVE indicator with animated green dot
- Scan ID
- Status Badge (Running → Completed)
- Elapsed Timer with clock icon
- Tool Tabs: Filter logs by tool (ALL | OPENSCAP | LYNIS | etc.)
- Level Tabs: Filter by severity (ALL LEVELS | ERRORS | WARNINGS)
- Console Output: Real-time scrolling log output
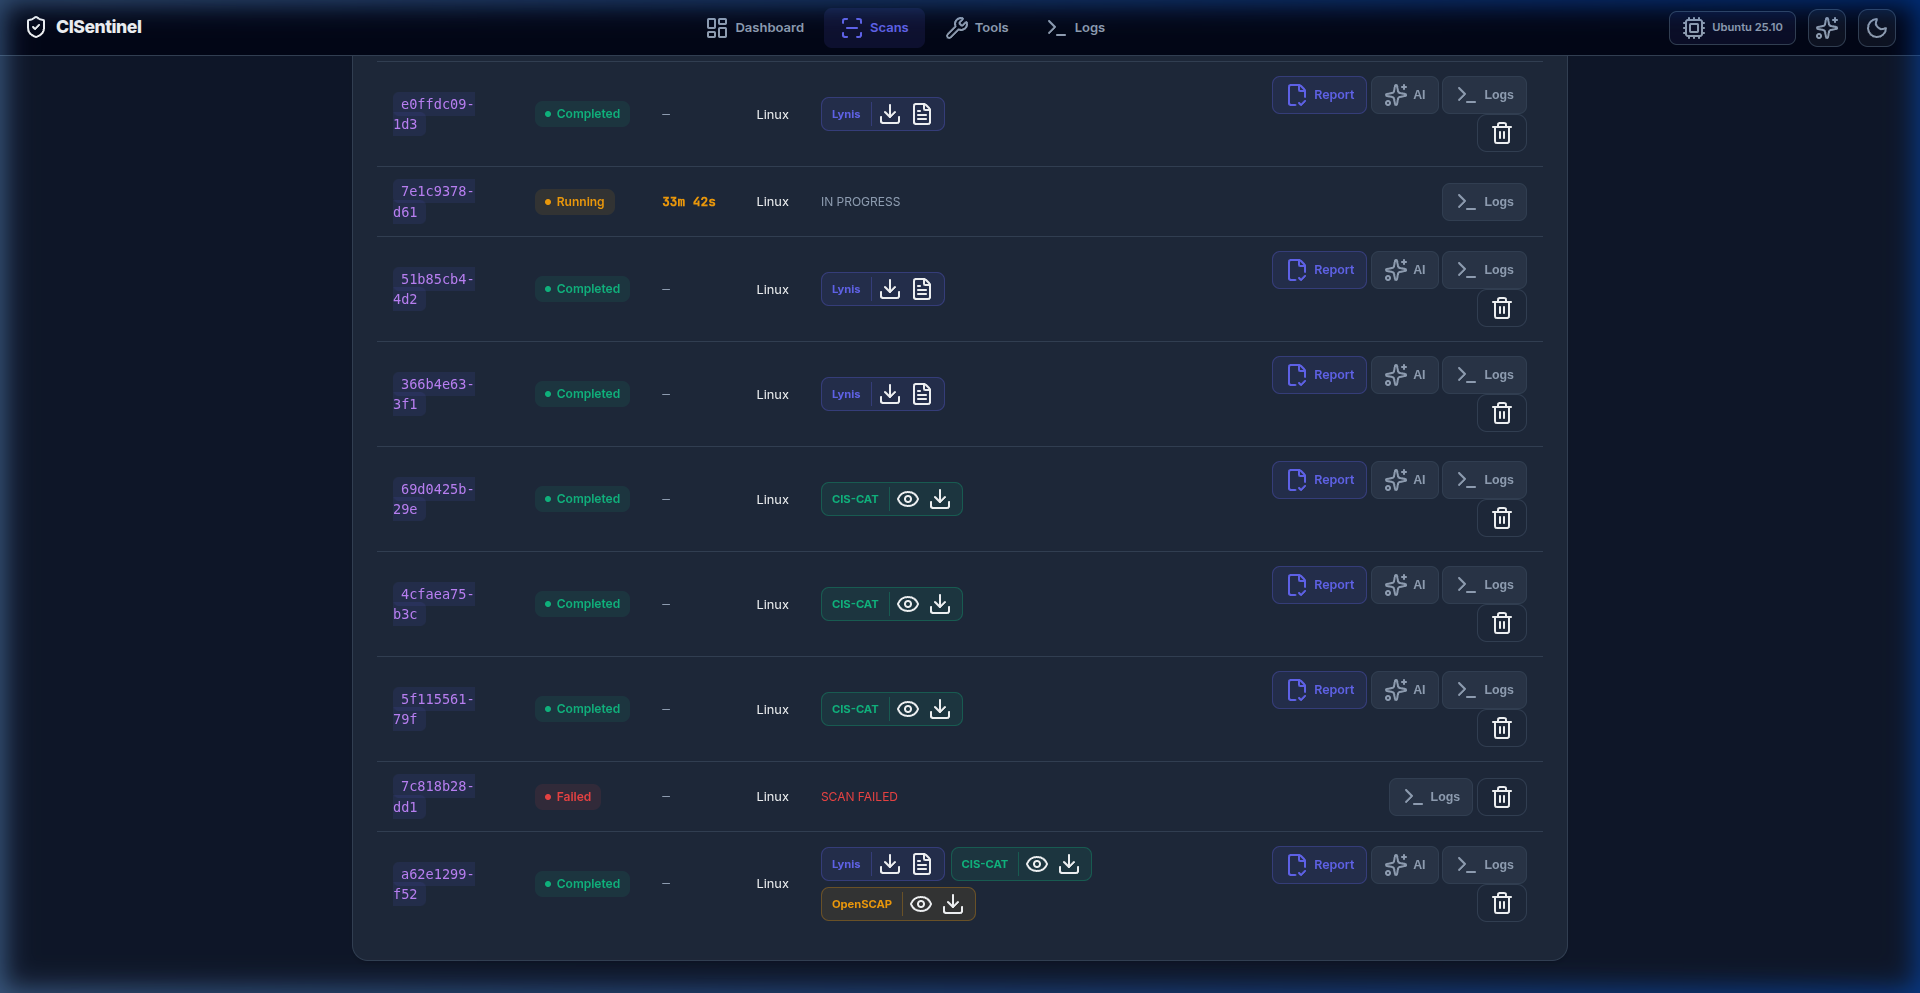
Scan Summary
When a scan completes, the live scan card shows: - Summary statistics (pass/fail counts) - Per-tool results - Action buttons (View Report, Export PDF/HTML)
Scan History Table
Below the new scan panel, a history table shows all past scans:
| Column | Description |
|---|---|
| Scan ID | Truncated UUID |
| Status | Badge (Completed / Failed) |
| Duration | Time taken (e.g., "45s") |
| OS | Operating system detected |
| Tools | List of tools used |
| Actions | View Logs, Export PDF, Export HTML, AI Summary |
Actions per Scan
- View Logs: Opens a modal with filterable console output
- Export PDF: Downloads consolidated PDF report
- Export HTML: Downloads consolidated HTML report
- AI Summary: Generates/shows AI analysis (if configured)
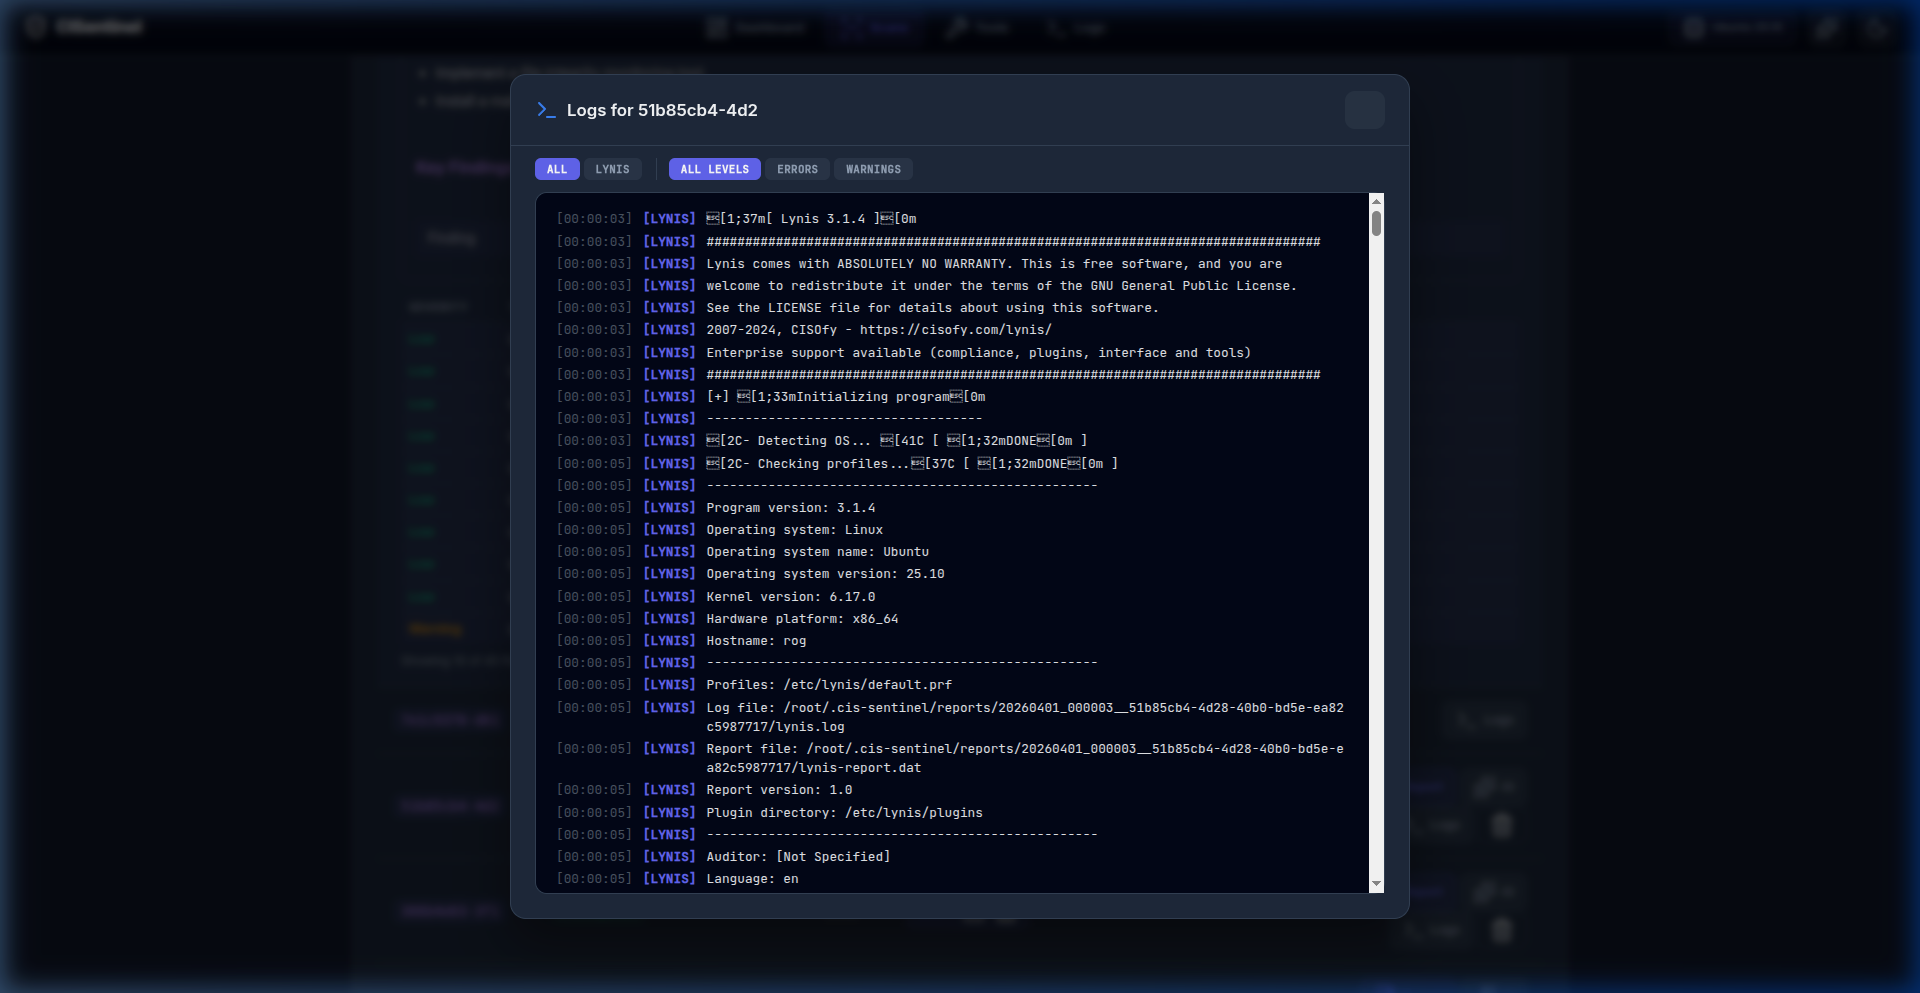
Scan Log Modal
Clicking "View Logs" on any scan opens a full-screen modal:
- Tool Tabs: Filter by tool
- Level Tabs: Filter by severity
- Console: Scrollable log output with syntax highlighting
- Close: X button or click outside