Dashboard Page Walkthrough
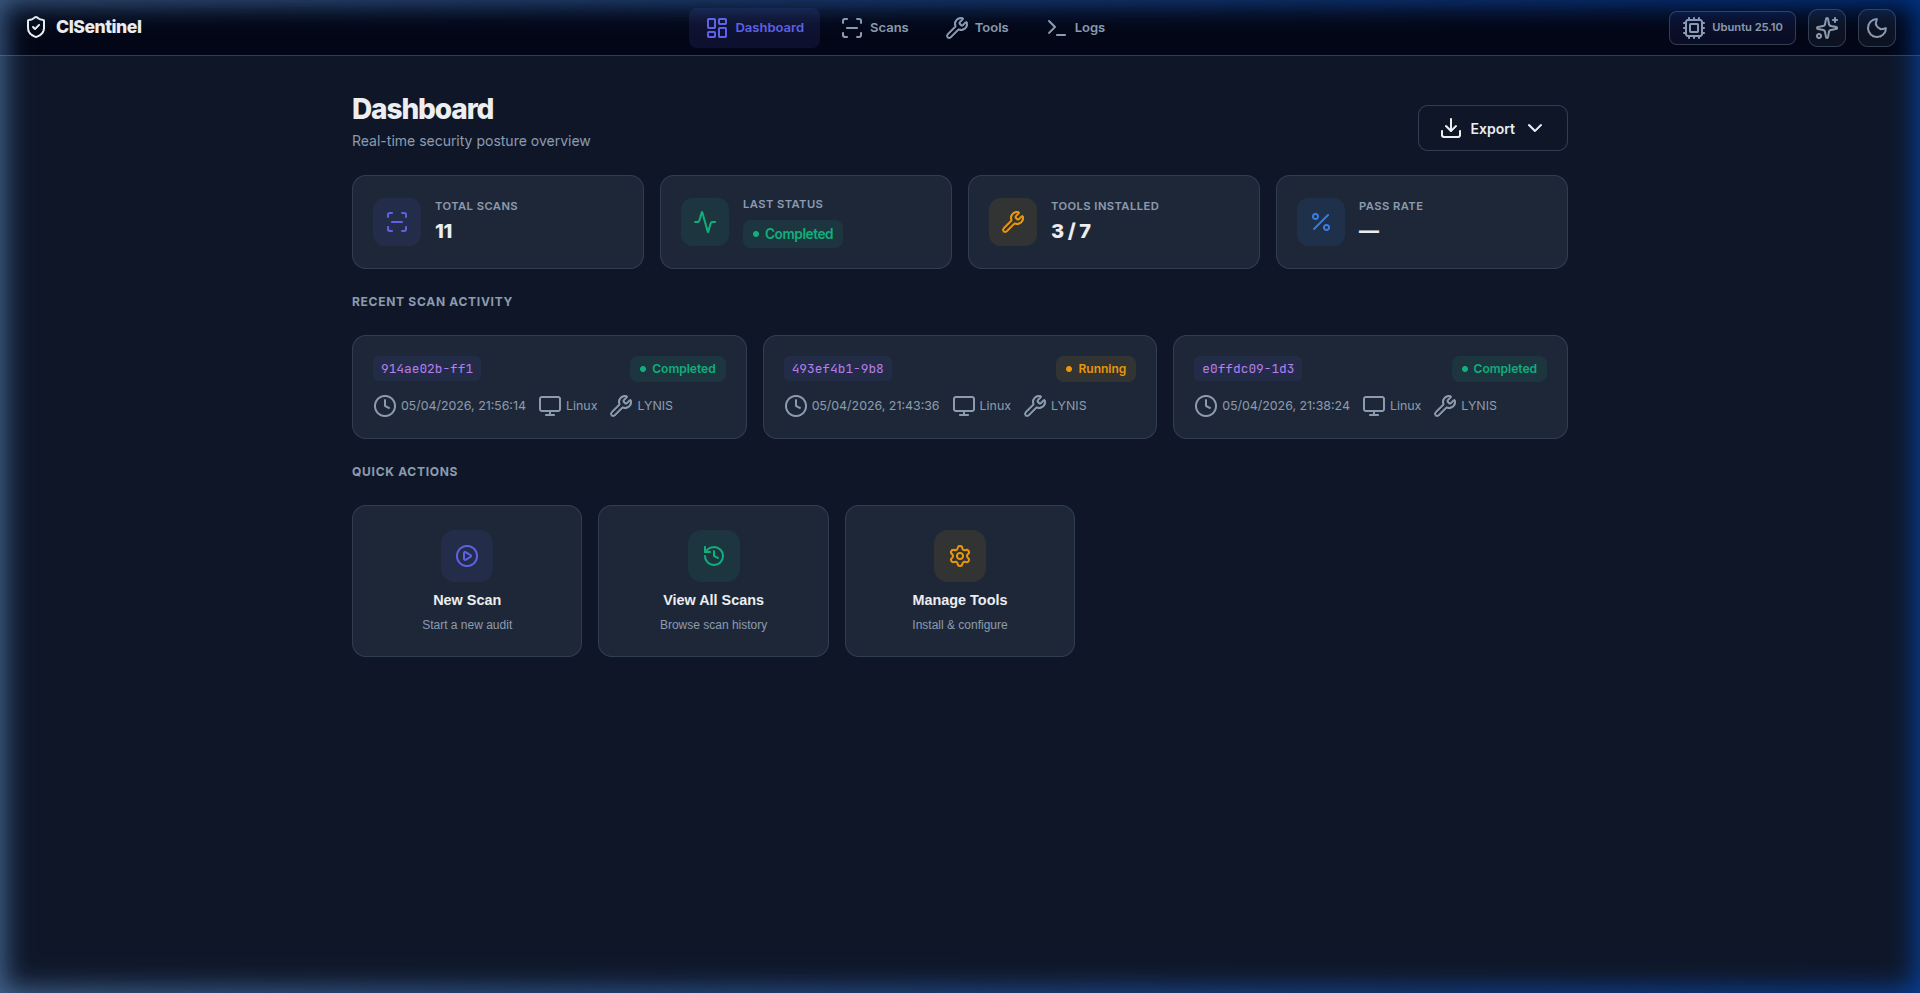
The Dashboard is the landing page of the CISentinel web GUI — a real-time security posture overview.
Accessing the Dashboard
- Start the web server:
sudo cis-hardening-tool server start --detach - Open browser:
http://localhost:8000 - The Dashboard page loads automatically
Page Layout
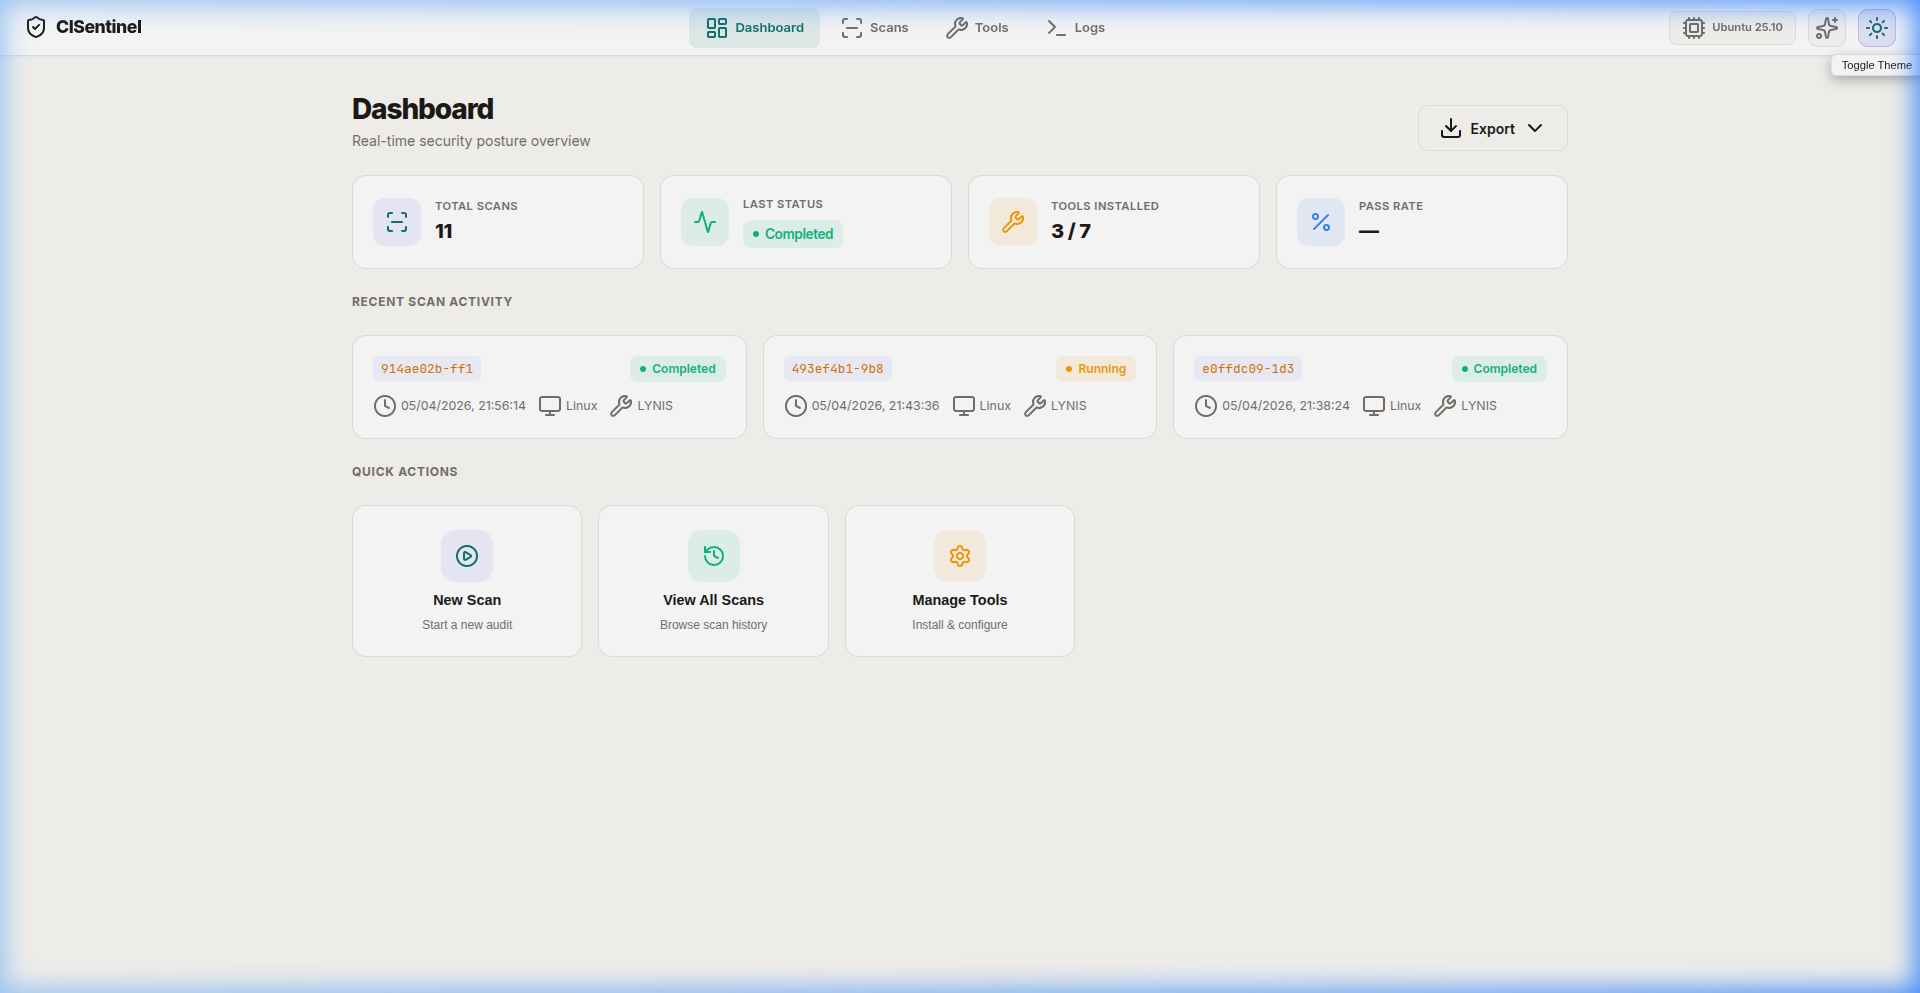
Top Navigation Bar
The navigation bar contains: - Brand Logo: Shield icon + "CISentinel" text - Navigation Tabs: Dashboard | Scans | Tools | Logs - OS Badge: Shows detected OS (e.g., "Ubuntu 22.04") - AI Settings Button: ✨ sparkles icon - Theme Toggle: 🌙 moon / ☀️ sun icon for dark/light mode
KPI Cards (4 cards)
| Card | Description | Icon Color |
|---|---|---|
| Total Scans | Count of all historical scans | Indigo |
| Last Status | Status of the most recent scan | Green |
| Tools Installed | X / Y installed vs total | Amber |
| Pass Rate | Percentage of rules that passed | Blue |
Recent Scan Activity
A grid of recent scan cards showing: - Scan ID (truncated) - Status badge (Completed / Failed / Running) - Duration - Tools used - Action buttons (View Logs, Export PDF/HTML)
Quick Actions
Three action cards: 1. New Scan → Navigates to Scans page 2. View All Scans → Navigates to Scans page history 3. Manage Tools → Navigates to Tools page
Export Dropdown
The "Export" button in the header provides: - Export as CSV: Downloads scan history as CSV - Export as JSON: Downloads scan history as JSON
Real-Time Updates
The dashboard connects via WebSocket to /ws and receives: - Initial state (all scans) on connection - Live updates when scans start/complete - Tool status changes